Home  /  Technology

Patented NMR + satellite imaging

How we read the Earth — step by step

Inside Earth identifies hydrocarbons, minerals and water directly at depth — remotely and non-invasively. Below is the full technology and its four-stage process, explained and illustrated.

+0 m

Maximum depth reach

0 km²

Coverage per project

00 mo

Time to results

0%

Remote, zero on-site

Scientific Foundation

We read the formula. We don't infer it.

Every atomic element and molecular compound has a unique electromagnetic signature — a quantum fingerprint as immutable as a barcode. Inside Earth detects that signature directly.

Nuclear Magnetic Resonance (NMR) is the phenomenon by which atomic nuclei absorb and re-emit electromagnetic radiation at precise resonance frequencies.

Inside Earth amplifies and reads that signature remotely through the Earth's crust, using satellite imagery and proprietary gel filters tuned to the target frequency.

Analogy: imagine a room full of instruments playing at once. IE is the microphone with a filter that isolates exactly the frequency of the instrument you are looking for — with certainty, not probability.
Satellite imaging and Earth analysis
Satellite acquisition feeds change-detection, clustering and time-series analysis of the target signal.

Other technologies

  • Measure density (muon tomography)
  • Measure resistivity (ERT / IP)
  • Measure the surface (hyperspectral)
  • Measure structure (seismic)

→ then interpret

Inside Earth

  • Detects the atomic fingerprint (NMR)
  • Isolates the element-specific frequency
  • Measures concentration directly
  • Maps depth and thickness

→ direct identification

The Process

Four stages, fully remote

From orbit to a drill-ready target. Each stage uses patented technology and proprietary infrastructure — with zero on-site presence required.

01

Satellite imagery acquisition

Ultra-high-resolution multiband capture via the proprietary UNISCAN-24 ground station — covering far infrared, ultraviolet, microwave and the visible spectrum.

  • Bands: far IR, UV, microwave & visible
  • Coverage from tens to 10,000 km² per project
  • Fully remote — no field crews, no permits
Earth-observation satellite in orbit
Earth-observation satellite capturing multiband imagery over the target area.
Satellite sensor anatomy
Multiband sensors: optical land imager (visible/IR) and thermal infrared sensor.
False-color spectral scene
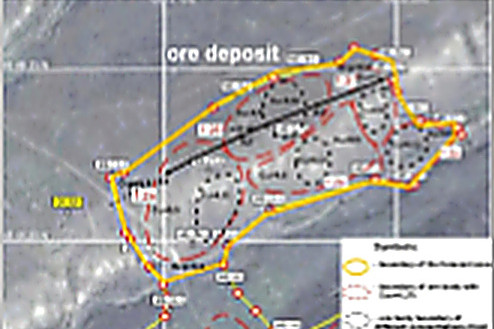
Raw multiband data is processed into spectral bands; gel filters isolate only the target compound’s signal from geological noise.
Depth gradient map
Lateral extent gradient map
The isolated frequency is resolved into depth and lateral-extent gradients across the target area.
02

Spectral transformation — atomic spectra

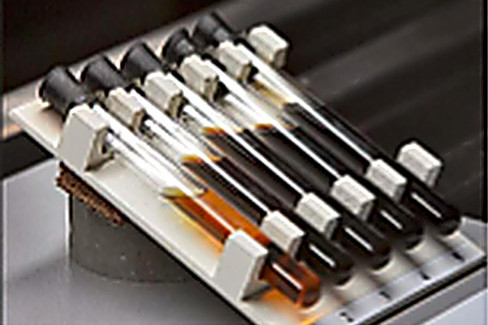
Satellite data is processed through patented Special Plates and gel filters built with references to the target compound’s NMR spectra, isolating its signal from all geological noise.

  • Gel filters tuned to the Element of Interest (EOI)
  • Isolates the target frequency, rejects noise
  • Works for HC, water, CO₂ and minerals alike
03

NMR amplification in the laboratory

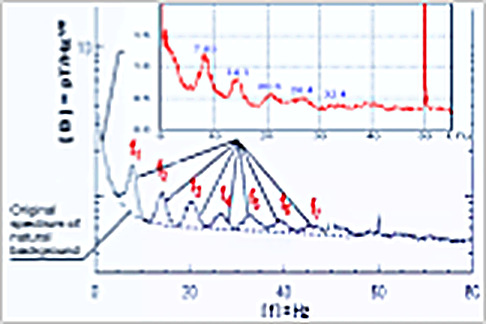
The IR-100 reactor amplifies the electromagnetic signals emerging at ground level while replicating lithospheric conditions. The resonance frequency of the target is matched against the field data — confirming presence or absence.

  • Controlled lithospheric replication + gamma irradiation
  • Identifies presence, depth and concentration
  • Diagnostics monitored from the control room
IR-100 reactor under maintenance
IR-100 reactor: lithospheric electromagnetic conditions are replicated under control.
Diagnostics control room
Diagnostics room: the target’s resonance frequency is matched against the field data.
3D anomaly survey visualization
3D anomaly model: georeferenced point cloud of the detected signal, by depth and intensity.
Layered data integration district to target
Layered integration: from district scale to a drill-ready target, refined by AI.
04

Business intelligence & deliverables

Results are turned into georeferenced anomaly maps with coordinates, depth (top/base), thickness, pressure estimates, fluid discrimination and drill-point recommendations — ready for your seismic and reservoir workflows.

  • Georeferenced contours, exportable to GIS / seismic
  • Depth, thickness & pressure per anomaly
  • Recommended drill coordinates & risk flags

Honest Scope

What IE identifies — and what it does not replace

Inside Earth is a pre-seismic intelligence layer. It tells you what is in the rock; seismic and reservoir engineering still define how to produce it.

What IE identifies

  • Molecular compound: oil / gas / condensate / CO₂ / water / mineral
  • Depth range (top and base) and thickness
  • Lateral extent and concentration / grade
  • Pressure estimation and gas-cap presence

What IE does not replace

  • Structural geometry (seismic still defines the trap)
  • Rock mechanics / geomechanical modelling
  • Flow rate and reservoir simulation
  • Reservoir engineering after confirmation

Deliverables

What the client receives

Every deliverable is georeferenced, pressure-calibrated and formatted for direct integration with your seismic workstations and reservoir databases.

Anomaly contour maps

Georeferenced polygons with precise coordinates of each identified zone, exportable as shapefiles for GIS and seismic platforms.

Depth & thickness profiles

Top and base depth for each anomaly, derived from NMR signal attenuation, with thickness estimation per zone.

Schematic cross-sections

Vertical columns showing lithological distribution and the positioning of each anomaly at depth.

Fluid & content discrimination

Categorical separation of hydrocarbons, water-saturated formations and CO₂ — plus explicit gas-cap flags.

Pressure & resource estimates

Pressure range per anomaly for safe well planning, plus preliminary inferred-resource estimation from anomaly geometry.

Drill-point recommendations

Optimized drill coordinates per anomaly from contour centroid and pressure-gradient analysis, maximizing hit probability.

Comparison

How IE compares to other methods

IE is the only technology that combines remote operation, molecule-specific identification and deep reach in one solution.

Attribute Inside Earth Seismic ERT / IP Hyperspectral Muon tomo. SAR
Direct element / HC detectionInferredIndirect
Max depth+7,500 mStructure only~200 mSurface~1 kmMeters
Remote / non-invasive100%PartialField crew
Environmental impactZeroHighMediumZeroMediumZero
50,000 km² speed2–4 moYearsYearsWeeksMonths/siteWeeks
Relative cost~10× lowerBaselineMediumLowVery highLow
Role vs seismicPre-seismicCore methodSupportEarlyLimitedSupport

Not a replacement for seismic — a pre-seismic intelligence tool that directs it: seismic is deployed only where IE has already confirmed presence.

Exploration Cycle

From years to months

IE enters before conventional methods. It does not replace them — it makes them dramatically more effective by compressing the early phases.

Traditional cycleYEARS
Regional geology
Seismic acquisition
Seismic interpretation
Exploratory drilling
Development
With Inside EarthMONTHS
IE remote NMR mapping
Focused seismic (IE zones only)
Earlier development · full intelligence

Validate it yourself

Ready to run a blind test on your own asset?

Give us an area where you already have drilling data. We deliver our results independently — you compare.