3D subsurface characterization of gold and copper deposits — anomalies, depths and volumes detected without a single physical drill hole.
See mining cases →Hydrocarbon reserves remotely delineated — anticlines, trap layers and pay volumes without exploratory drilling.
See oil & gas cases →Aquifers, freshwater currents and deep geothermal reservoirs characterized from surface — depth, thickness, salinity and flow direction.
See cases ↓
Twenty-three freshwater projects and seventeen geothermal surveys across thirty countries — from the Vietnamese highlands and the Wahiba sands to the Crimean peninsula, the Mongolian steppe, and the Sahara. Each one resolved the same question without a single exploratory drill: where exactly to drill, how deep, and what flow rate to expect.
Geothermal water flow detected at two distinct depth horizons along the same vertical section. Shallow heat-exchange resource plus deep, high-pressure geothermal target — one survey, two extraction strategies.
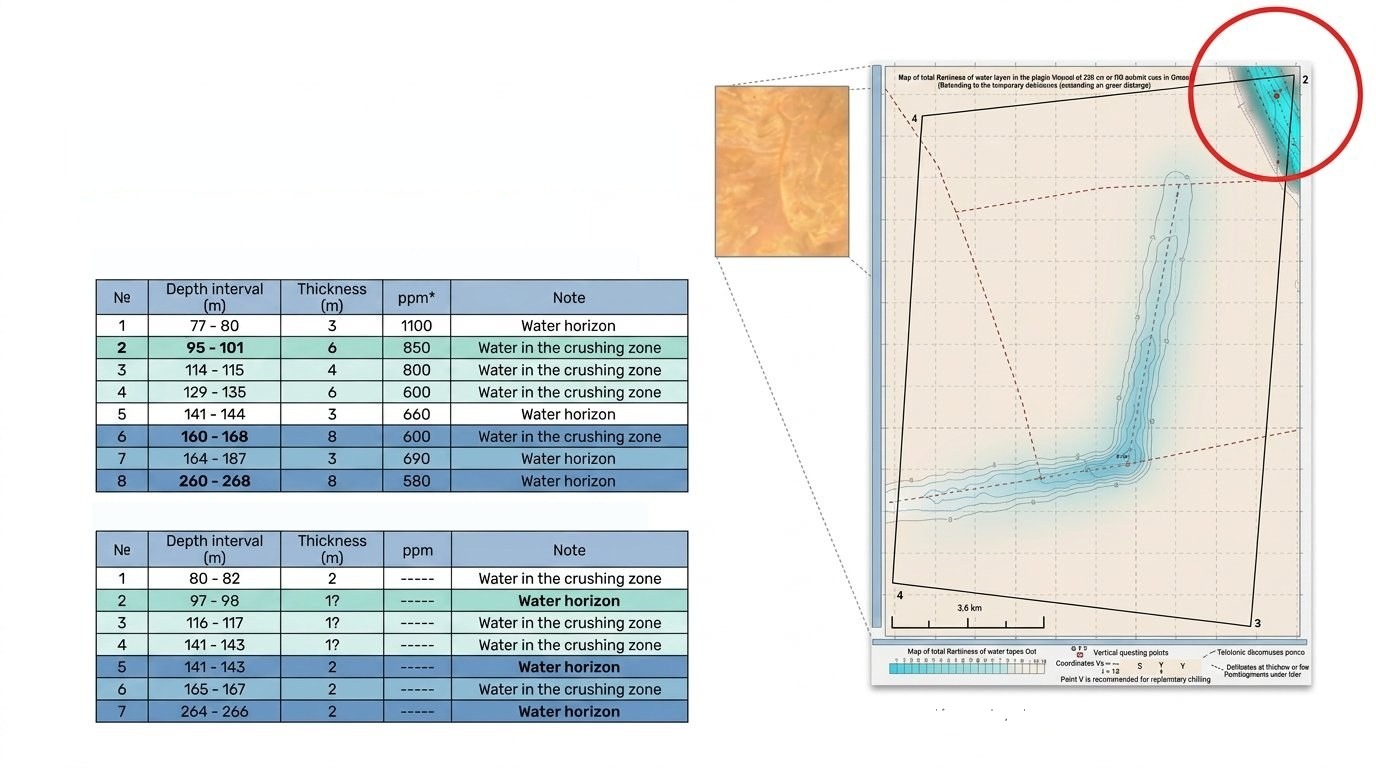
Two scanning verticals 2.2 mi (3.6 km) apart resolved eight aquifer layers between 253 and 879 ft (77 and 268 m). Seven of eight confirmed continuous; salinity falls steadily with depth from 1,100 to 580 ppm.
Aquifer geometry defined remotely (1.9 mi / 3 km × 984 ft / 300 m, self-discharge confirmed), single drilling validated the prediction at the recommended point — 1 million people-equivalent potable supply.
Two underground freshwater currents 2.5–3.1 mi (4–5 km) wide and 148 ft (45 m) thick delineated; two confirmation wells drilled. Industrial well field projected to deliver 1.5 billion liters per year.
Commercial freshwater flow discovered in the Sahara, meeting drinking water standards. Output sufficient for an estimated 11 million people per day.
Provide us with an area with existing drilling data and compare our independent results. First meeting, no commitment.
Inside Earth surveyed a Vietnamese site for geothermal resource. The remote workflow generated a vertical depth section of the survey area along a single A–B traverse, with two scanning verticals (1T and 2T) sampled across the 2.5 mi (4 km) transect. Two distinct anomalies emerged on the same section.
Vertical 1T showed a continuous geothermal anomaly from surface down to 12,030 ft (3,668 m) — a single, deep, high-temperature target ideal for power generation via deep wells. Vertical 2T, only 2,620 ft (800 m) away laterally, showed a completely different signature: a shallow horizon at 0–863 ft (0–263 m) followed by a thin deep layer at 11,590–11,990 ft (3,534–3,654 m). The two verticals on one section reveal that the geothermal water flow geometry is asymmetric — a finding that conventional single-vertical methods would have missed entirely.
Three surface maps place the survey in context: the boundary polygon, the anomaly zones detected within it, and the traverse along which the depth profile was built.
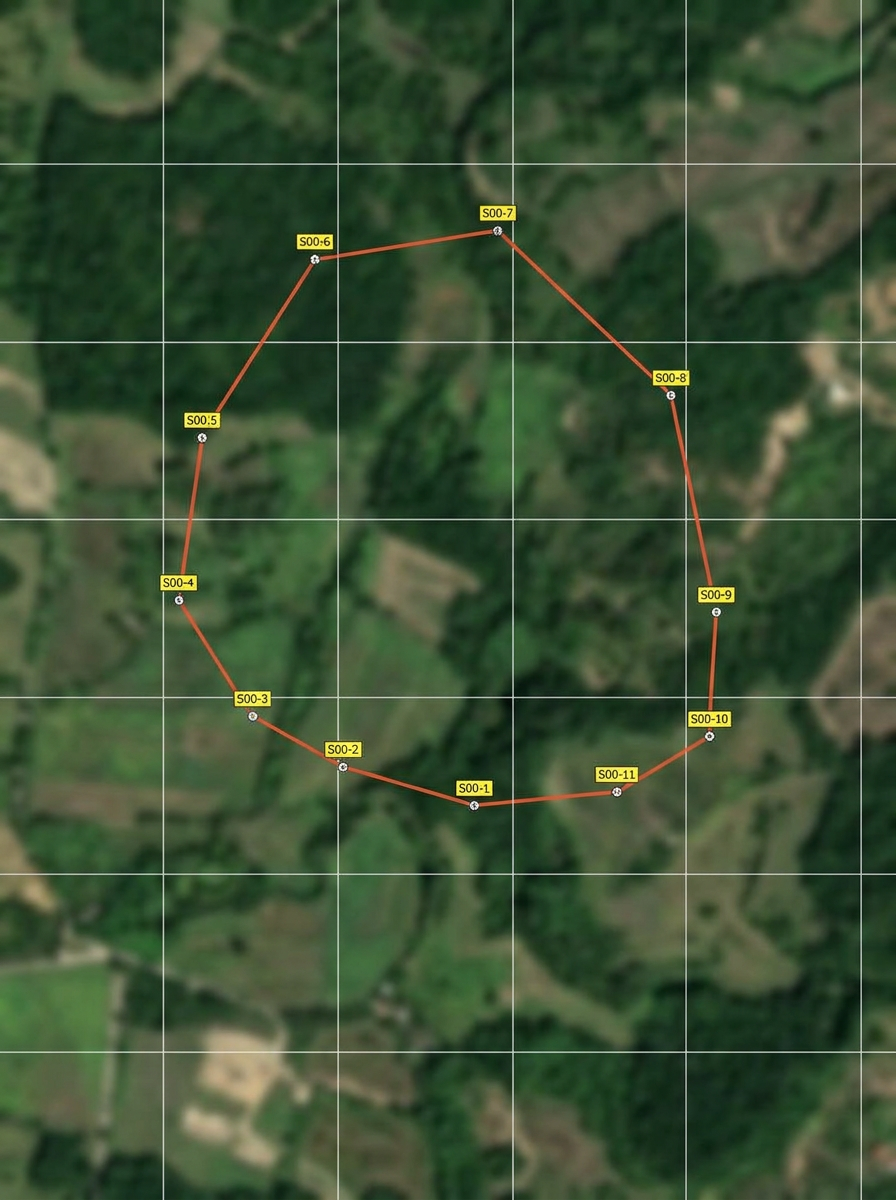
Map 1. Closed traverse of the 11 boundary points that delimit the surveyed area. Data shown is for illustrative purposes.
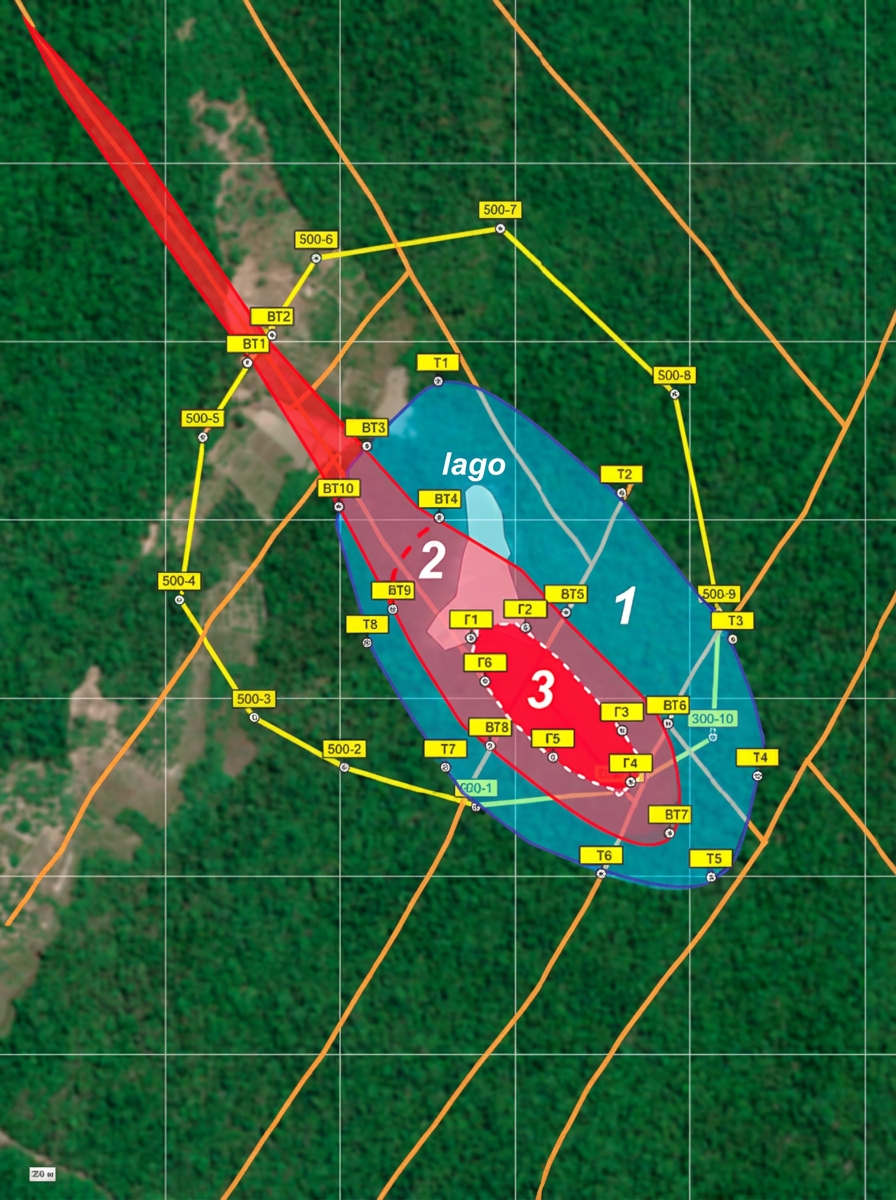
Map 2. The three nested anomaly zones and the vertical measurement points of the BT, T and Г series, with the lake as a surface reference. Data shown is for illustrative purposes.
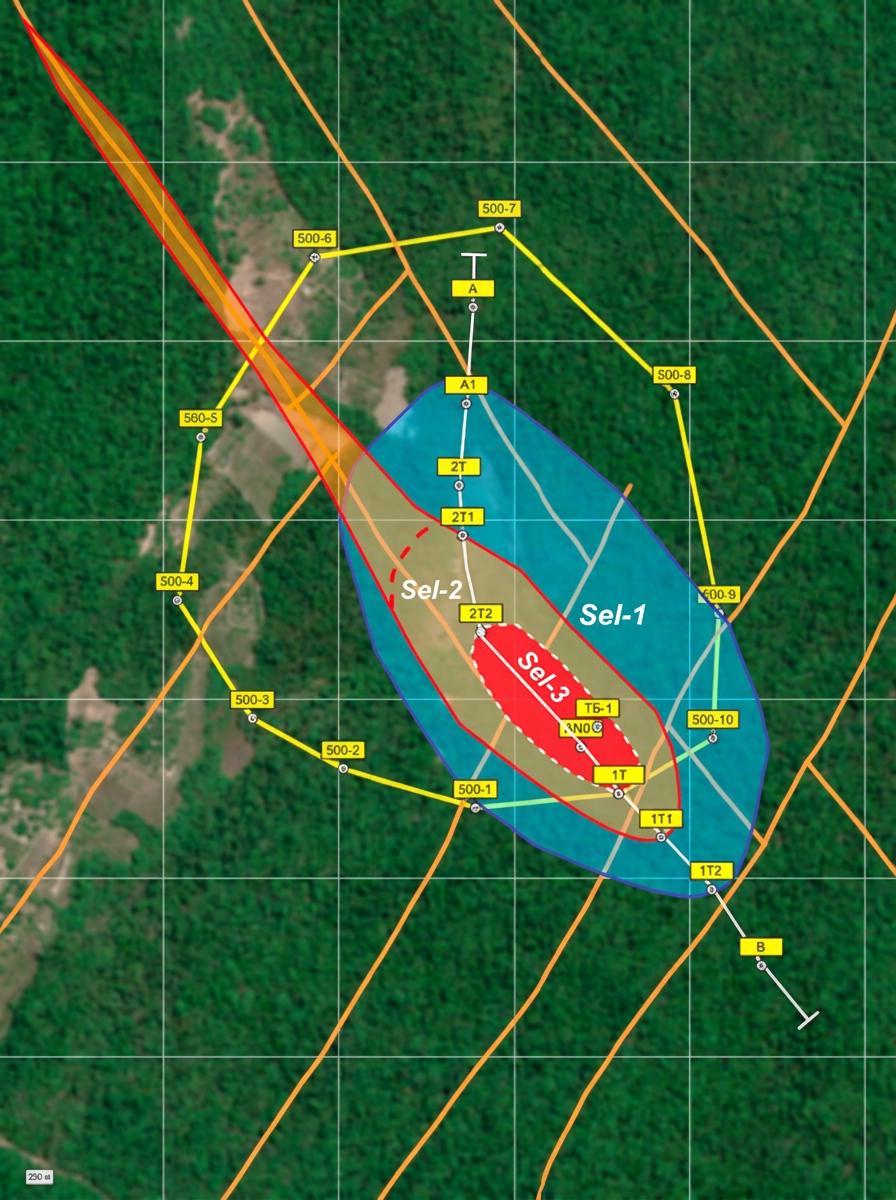
Map 3. The same three zones labelled Sel-1, Sel-2 and Sel-3, with the A–B traverse and the verticals from which the depth profile below was built. Data shown is for illustrative purposes.
The 1T vertical shows the entire 0–12,030 ft (0–3,668 m) column as anomalous — suitable for a single deep well harvesting heat across the full depth range. The 2T vertical, in contrast, splits into a shallow 0–863 ft (0–263 m) horizon and a deep 11,590–11,990 ft (3,534–3,654 m) thin layer, with the rest of the column inert. Both verticals are part of the same resource, but each requires a different drilling strategy.
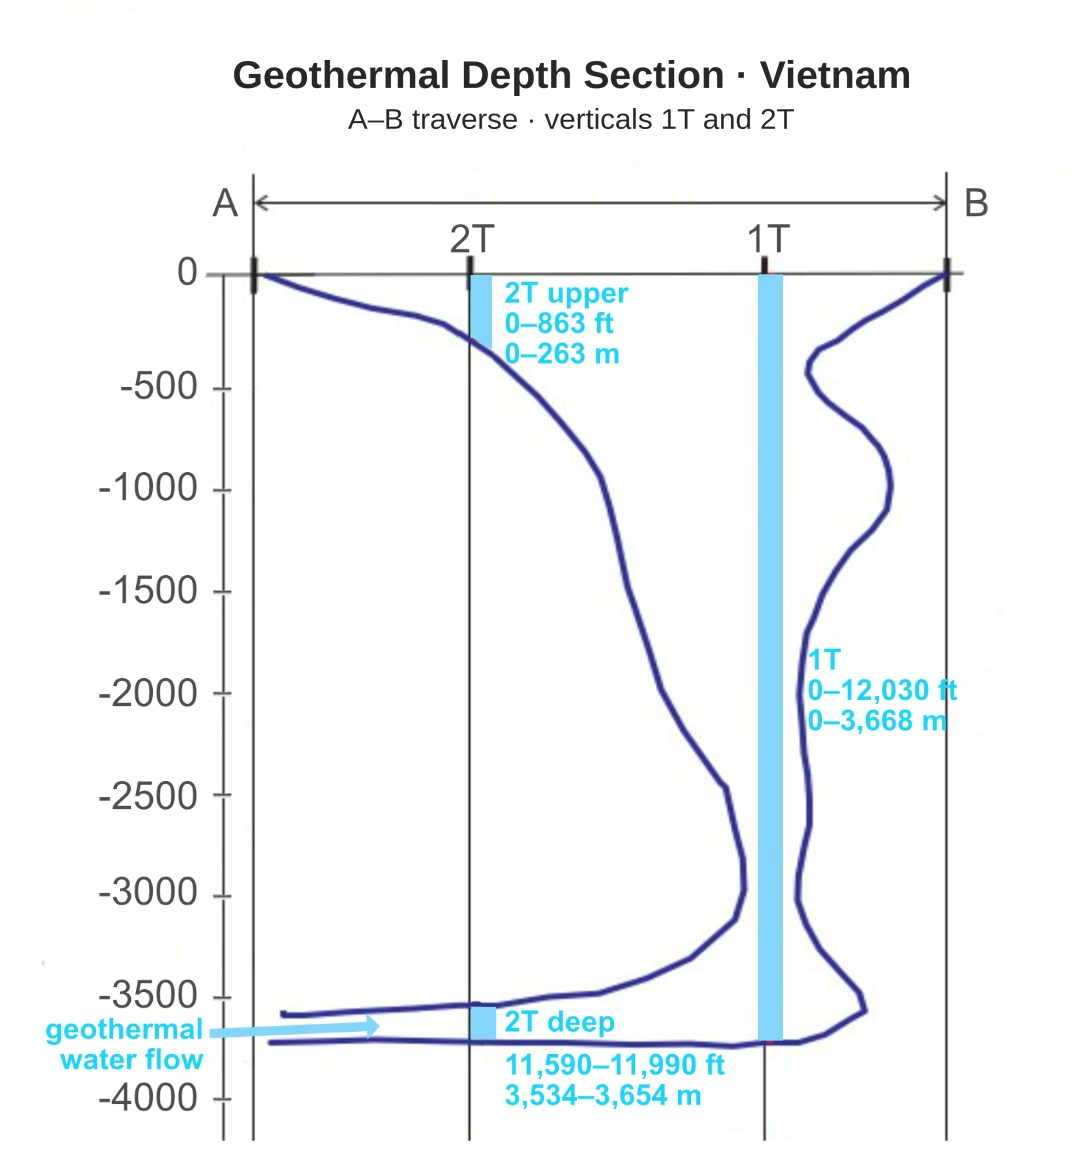
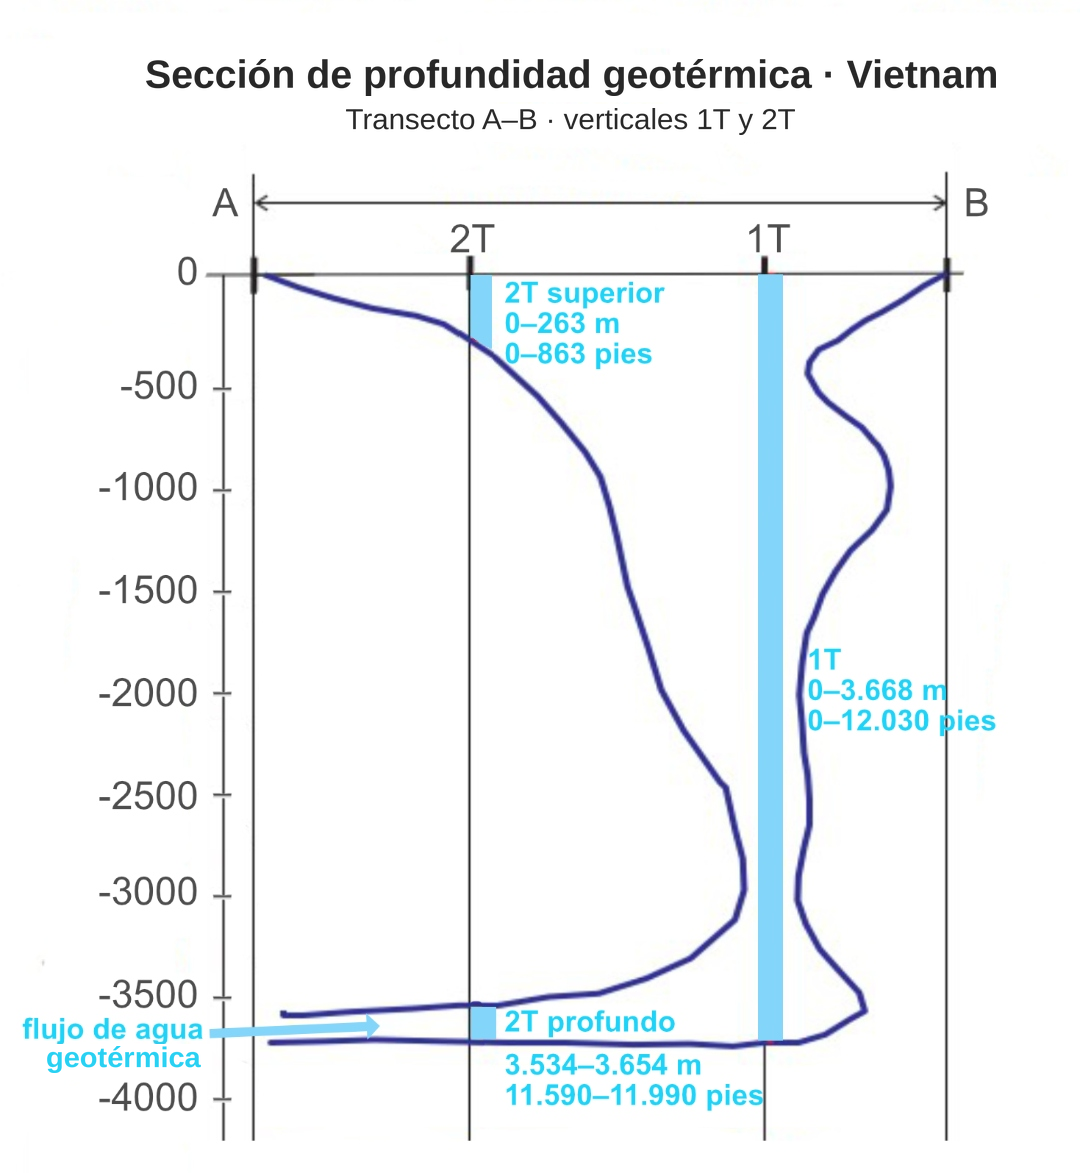
Data shown is for illustrative purposes.
Inside Earth conducted a detailed vertical exploration in the Wahiba Desert. Two remote scanning verticals — V1 and V2 — were placed 2.2 mi (3.6 km) apart on the survey area, and at each one the full 0–984 ft (0–300 m) subsurface column was profiled for water content. The result was a stratigraphic map of unusual vertical resolution: eight aquifer horizons stacked from 253 ft (77 m) to 879 ft (268 m).
Seven of those eight horizons appear at matching depths in V2, confirming lateral continuity across the survey area — these are sheet-like aquifers, not isolated lenses. Only one horizon (604–614 ft / 184–187 m at V1) had no V2 counterpart, identifying it as a local lens. The salinity gradient tells its own story: it falls steadily with depth from 1,100 ppm at the shallowest horizon to 580 ppm at the deepest — the deeper the resource, the fresher the water. V1 was issued as the recommended exploratory drill point.
Click the image to enlarge
Data shown is for illustrative purposes.
Result tables at the V1 and V2 scanning points and a map of the survey area (2.2 mi / 3.6 km baseline). Eight stacked aquifer horizons between 253 and 879 ft (77 and 268 m); salinity falls from 1,100 to 580 ppm with depth.
The visualization below shows the eight aquifer horizons recovered from the V1 vertical, projected across the survey area. Seven of the eight extend continuously to the V2 vertical 2.2 mi (3.6 km) away (rendered as full-area slabs); the 604–614 ft (184–187 m) lens, present only at V1, is shown as a localized body. Color intensity encodes salinity: lighter celeste at the deepest, freshest layer (580 ppm), deepening to saturated blue at the shallowest, most saline layer (1,100 ppm).
Data shown is for illustrative purposes.
A regional water utility approached Inside Earth with a high-stakes question: was there sufficient potable groundwater under the Chernorechenskoye reservoir area to justify a deep production well, and if so — exactly where? A failed deep drill at this depth range would cost more than the entire remote survey.
Inside Earth executed a 12.4 sq mi (32 km²) remote geocosmic survey with photographic reconnaissance and spatial image interpretation. In two months, the team profiled an underground water anomaly with full geometry: limits, flow direction, total salinity, depth and thickness of the productive horizon. The recommendation specified a single drilling point with self-discharge guaranteed by aquifer pressure. Drilling at the recommended coordinates delivered 2,200 t/day of potable freshwater — confirming every parameter predicted from orbit.
Inside Earth's groundwater theory rests on a recurring geological process: at extinct-volcano magma centers, seawater is drawn in at depth, evaporated, and the resulting steam migrates along faults until it cools and condenses into underground freshwater lakes. From those lakes, currents flow outward at depths of several hundred meters. The Chernorechenskoye aquifer is fed by one such mechanism — boiler N°2, in the Crimea peninsula.
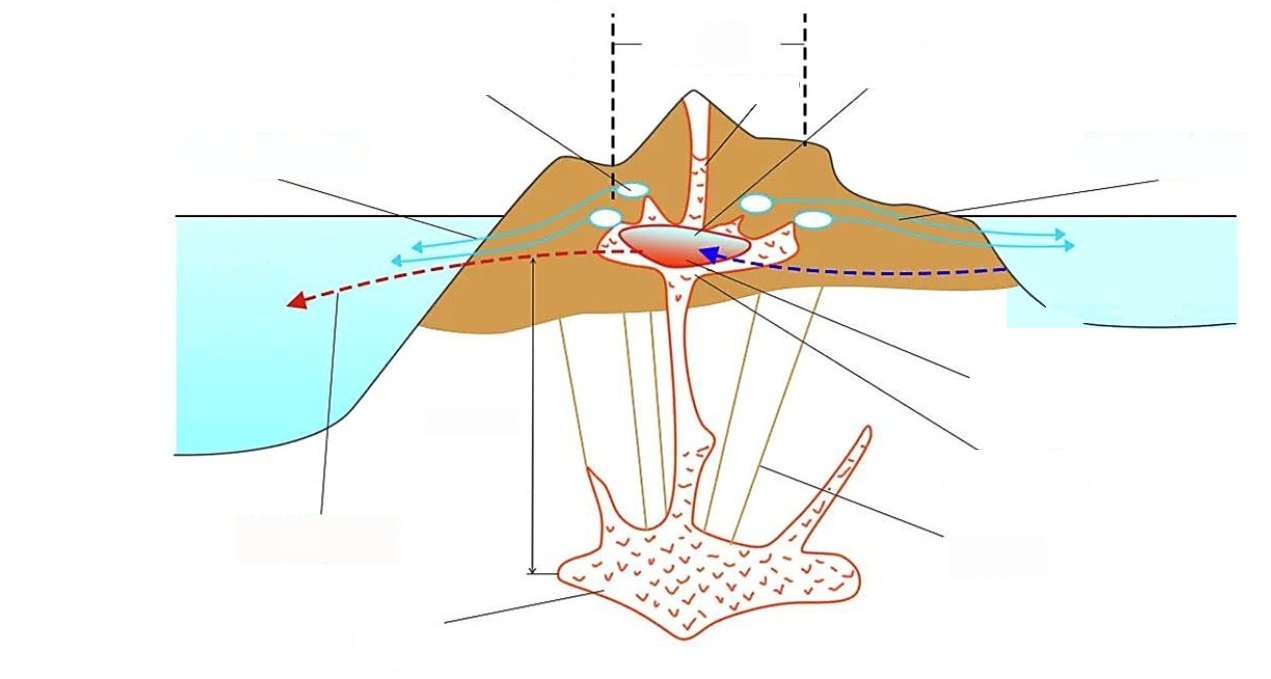
Data shown is for illustrative purposes.
Inside Earth conducted research and exploration for groundwater across 133 sq mi (345 km²) of the Gobi Desert in Mongolia in three months. Two underground freshwater currents were identified at depths of 886 to 1,030 ft (270 to 315 m), with a horizon thickness of 148 ft (45 m) and current widths between 2.5 and 3.1 mi (4 and 5 km), covering most of survey areas N°2 and N°3. Survey area N°1 returned no significant flow — and was excluded from drilling.
The client drilled two exploration wells only on the confirmed currents. They returned the predicted flow rates — 21.2 cfs (0.6 m³/s) and 56.5 cfs (1.6 m³/s) respectively. The economic projection that followed: 25 industrial wells of 200–270 mm diameter would deliver 1.5 billion liters of water per year, equivalent to the annual consumption of two million people.
In conventional exploration, all three sectors would have received scout drilling. With Inside Earth's studies, only the two anomaly zones were drilled — and both confirmed at the predicted flow rate. Millions of dollars and years of study were thereby saved.
Two confirmation wells drilled out of three candidate sectors — one third of the survey area never required a single drill meter.
Both confirmation wells returned the predicted flow rates (21.2 and 56.5 cfs / 0.6 and 1.6 m³/s) within the documented confidence interval.
The 25-well field projection — a function of confirmed current geometry, not optimistic extrapolation — delivers two million people-equivalent per year.
The Geology Department of Mauritania's Ministry of Energy commissioned the search for natural freshwater deposits across a sector of the Sahara Desert. The challenge: arid surface, no infrastructure, no roads, no prior geological reference — a 618 sq mi (1,600 km²) block to be characterized remotely before any field equipment moved.
Inside Earth deployed remote sensing methods over the entire area, then validated parameters at selected anomaly points using field NMR equipment. The combination confirmed groundwater currents and pinpointed extraction coordinates. A commercial flow at 246 ft (75 m) depth, extending to 492 ft (150 m), was discovered and delivered to the client at 900 tonnes per hour — meeting drinking water standards.
The Sahara at this latitude offers no surface clues. There are no streams, no vegetation belts, no obvious recharge zones. Conventional groundwater exploration would have required years of seismic-then-drilling iteration, with most boreholes returning saline water or dry. The economic and environmental cost of that approach made the entire program unviable.
The Ministry of Energy needed something different: a method that could cover the full 618 sq mi (1,600 km²) in months, not years, and deliver coordinates with enough confidence to drill once and drill right.
Inside Earth has discovered seventeen extinct-volcano magma chambers ("boilers") that generate underground freshwater and geothermal currents. Each confirmed boiler explains the freshwater inventory of a wide territory — and points to the optimal extraction zones along the discharge currents.
Data shown is for illustrative purposes.
The Inside Earth pipeline has the same five stages whether the target is freshwater, geothermal, hydrocarbons or minerals. What changes is the atomic reference loaded into the patented gel filter — water, hydrogen sulfide, a noble gas, a metal. The signal physics stays constant.
The elements of interest are defined with the client and their samples are prepared for the laboratory. The reference spectrum of each target is captured against the natural background, which fixes the atomic reference used in every subsequent stage.
Ultra-high-resolution imagery from various satellites, received at the UNISCAN-24 ground station. Processed for spectral reflectance, anomaly identification and tectonic-fault tracing across the survey area.
The processed satellite images pass through proprietary plates and a gel filter loaded with the atomic reference of the compound of interest — water in this case. The output is a first-order map of the target's spectral signature.
Nuclear magnetic resonance combined with amplification of electromagnetic signals from the imagery. The proprietary technique determines the location, depth, thickness and quality of the targeted atomic element with up to 24,610 ft (7,500 m) of subsurface resolution.
Synthesized, georeferenced reports tailored to client needs: aquifer contours, well coordinates, salinity classification, current direction, horizon thickness and recommended drilling depth — everything required for a single confirmation drill.
Predictive accuracy of remote NMR delineation versus on-site exploration — confirmed across the freshwater and geothermal portfolio.
Inside Earth is the only remote provider in the market that offers superior accuracy at a cost an order of magnitude below on-site solutions.
Optimal drilling coordinates within 3 to 4 months per 3,861 sq mi (10,000 km²), or 2–3 years for 38,610 sq mi (100,000 km²) — competitors take 3 to 10× longer.
Subsurface resolution to 24,610 ft (7,500 m) — covering shallow aquifers and deep geothermal targets within a single methodology.
If your operation could benefit from a five-stage NMR workflow — sample preparation, satellite reconnaissance, spectral transformation, NMR delineation and decision-grade deliverables — across an arid concession, a recharge basin or a geothermal lease, the Inside Earth technical team can scope alignment, lead time and deliverables in a no-commitment first meeting.